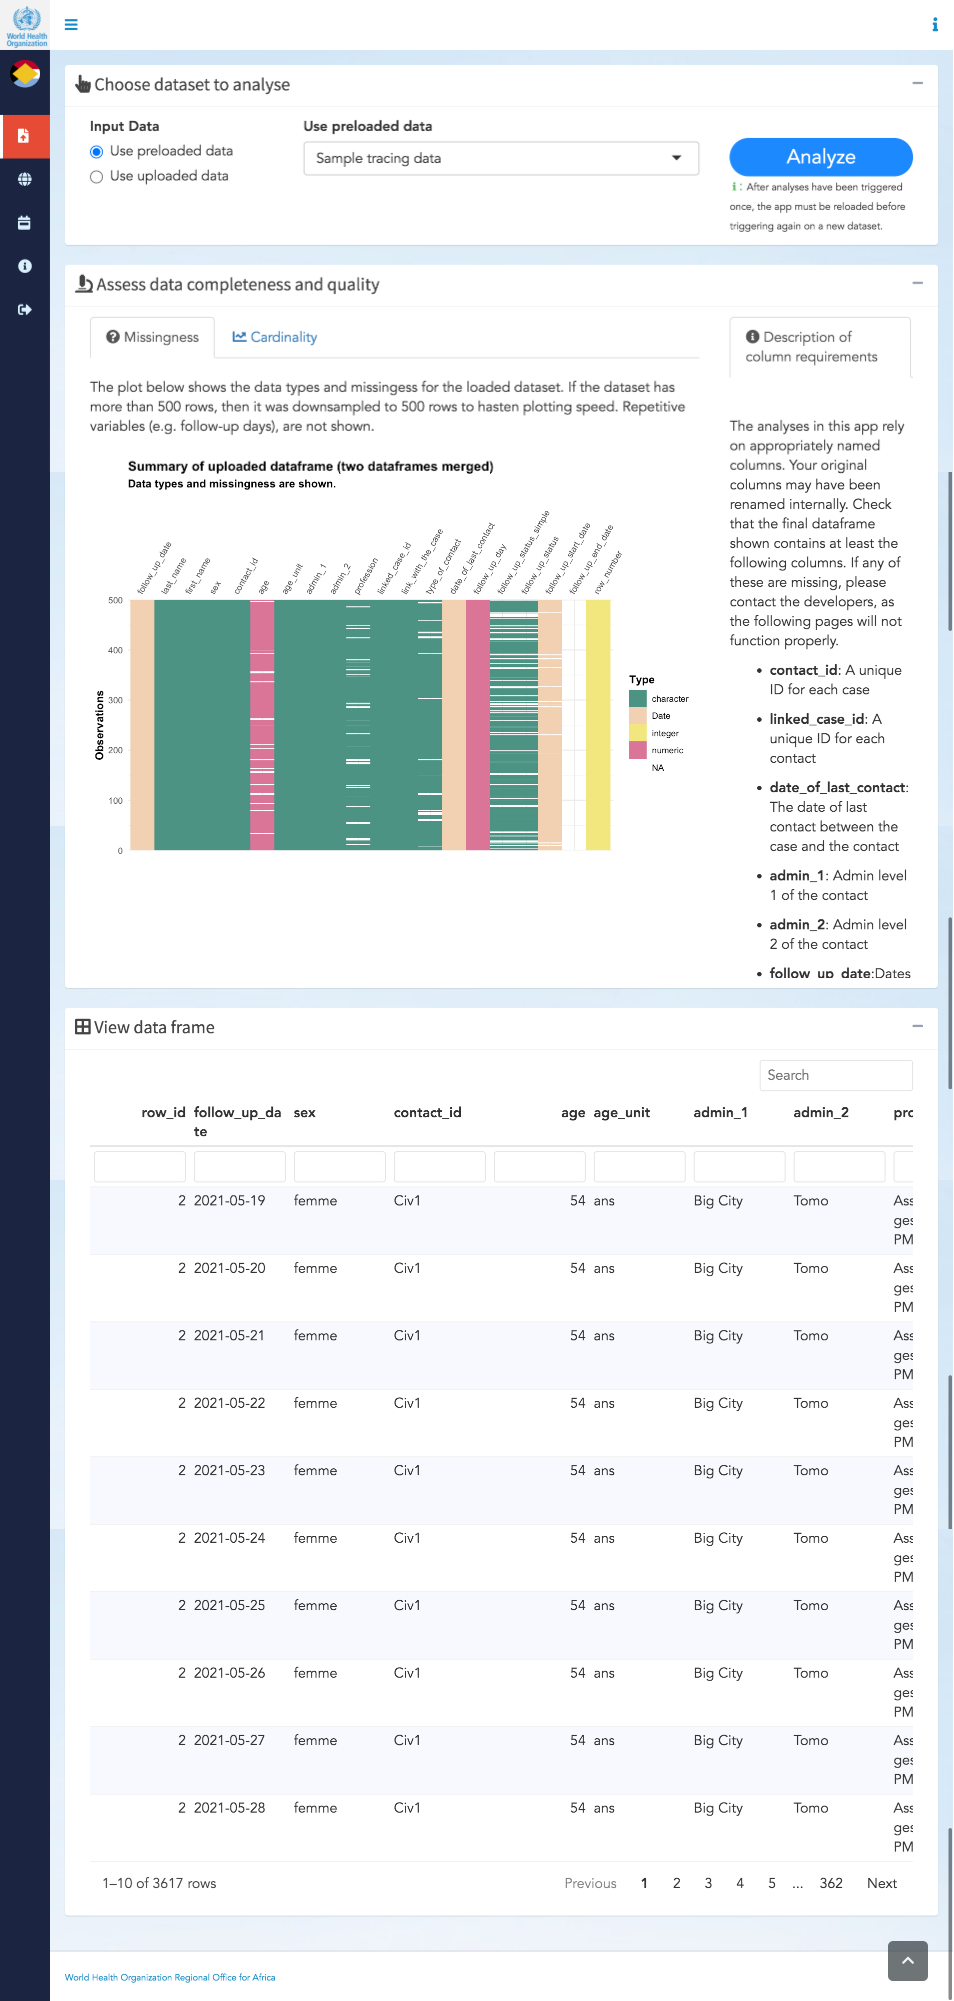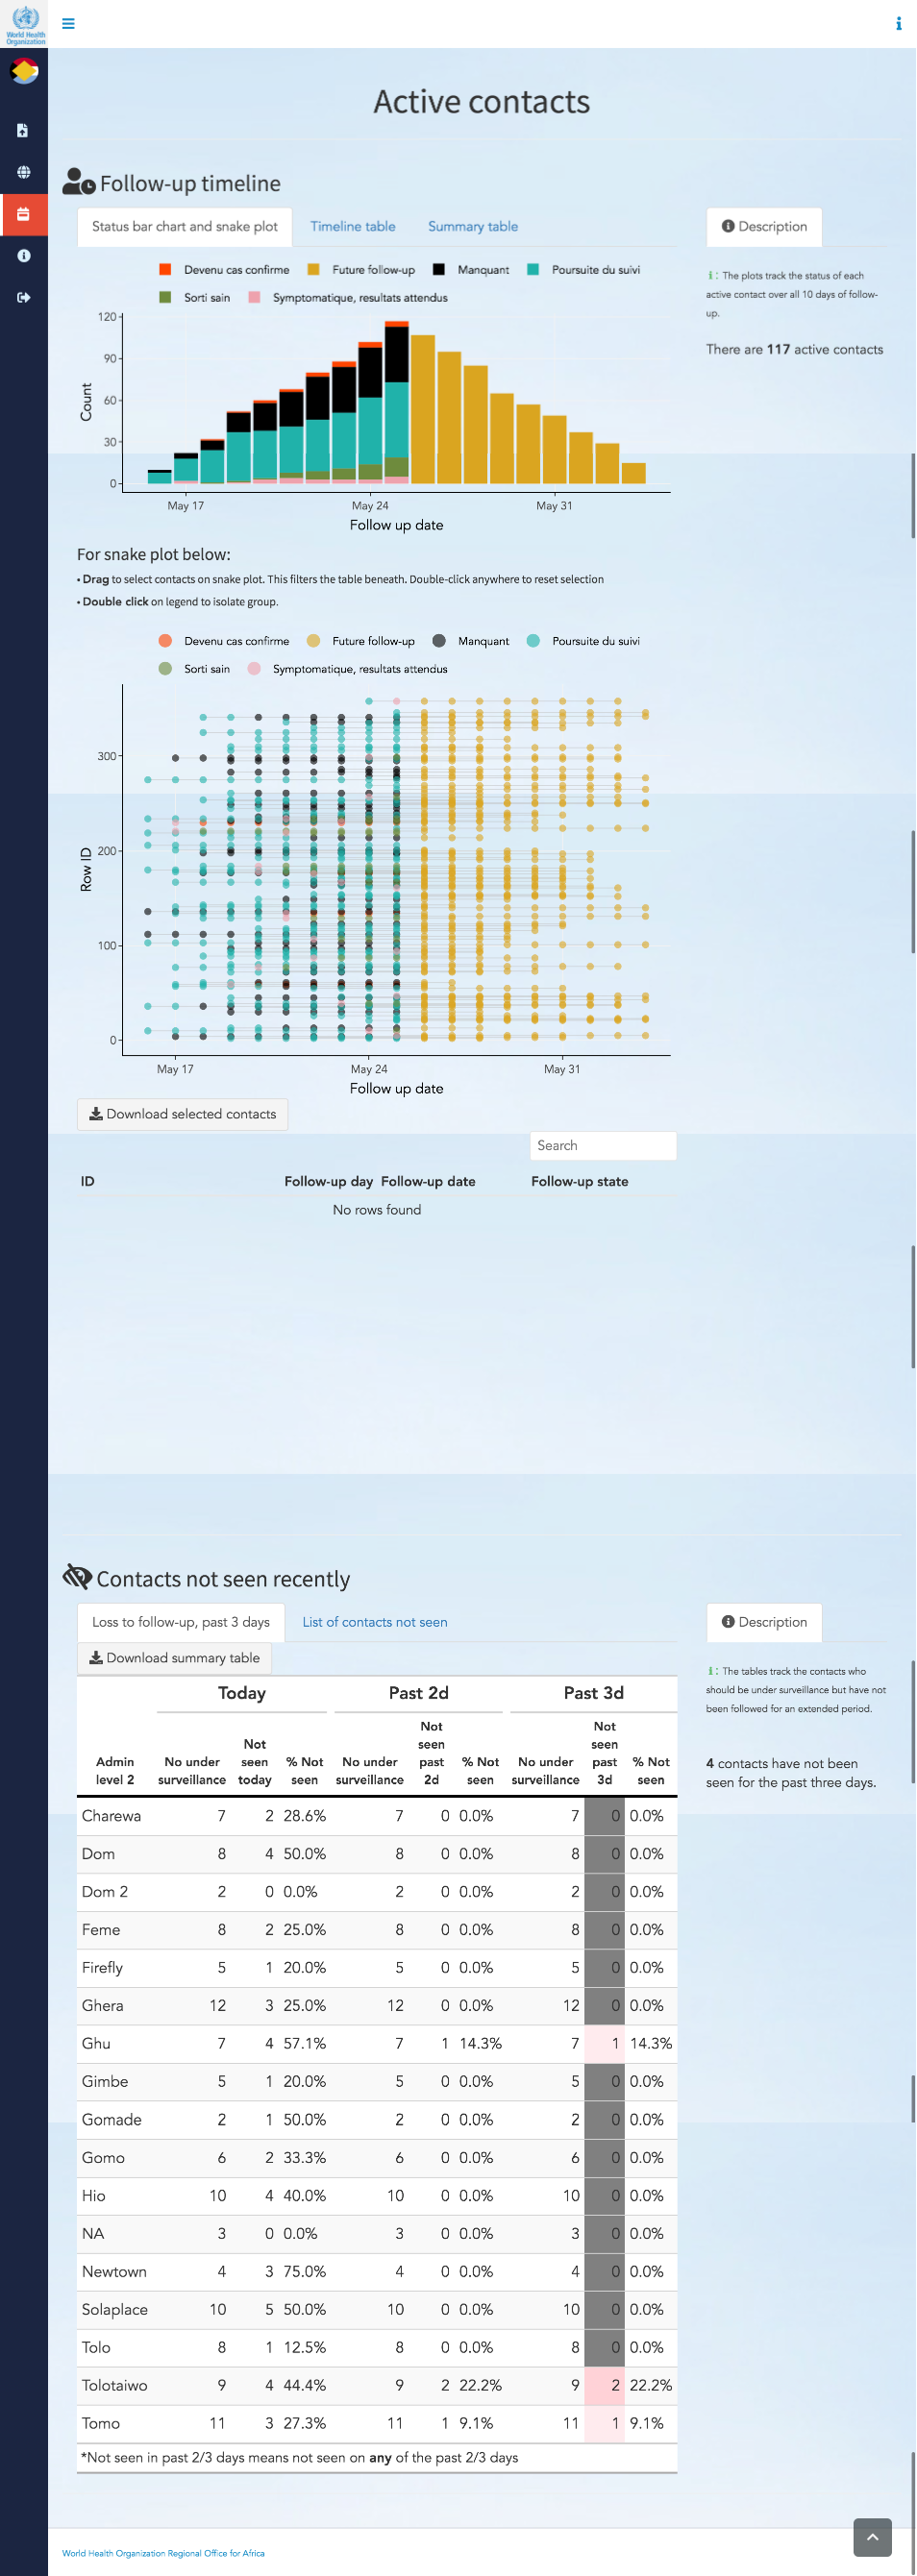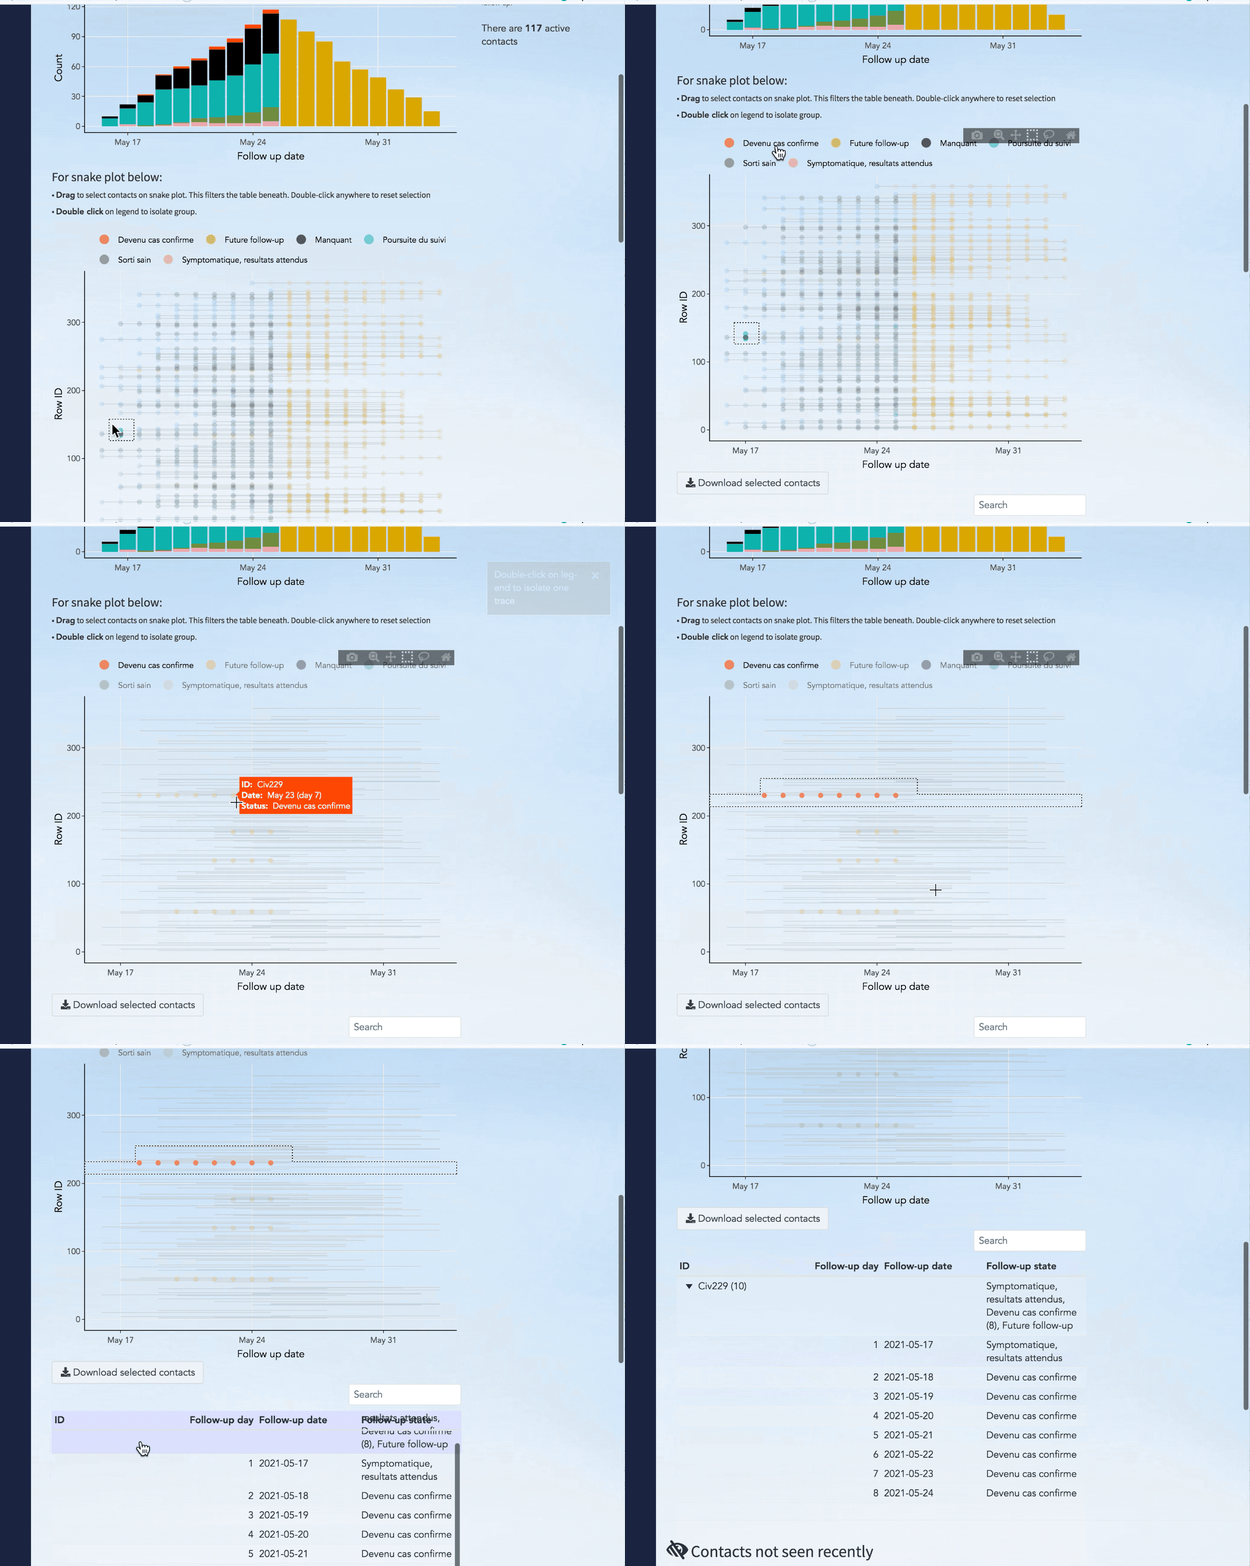
This repo contains the code for GoContactR, an R-shiny application built to allow contact tracing teams to generate automated reports that summarize contact follow-up data.
Find a sample live app HERE.
The application has been built to work with two primary data sources: data from KoboCollect-exported csv files, and data from a Go.Data instance (by direct API connection).
At the start of the global.R file, the developer sets the PARAMS$country_code variable; this determines whether the Go.Data or KoboCollect versions will be loaded.
Deployment
We recommend deploying your application to RStudio’s shinyapps.io service, as they have built-in tools that make this process mostly pain-free.
Two important points when doing this:
Do not push the DESCRIPTION file up to shinyapps.io. If you push the DESCRIPTION file, shinyapps will assume that your application is package, and it will only load libraries listed in the DESCRIPTION file. (We created the description file to enable documentation via
pkgdown).Similarly, do not push the .Rprofile file. This will introduce problems related to the
renvpackage.
Folder structure
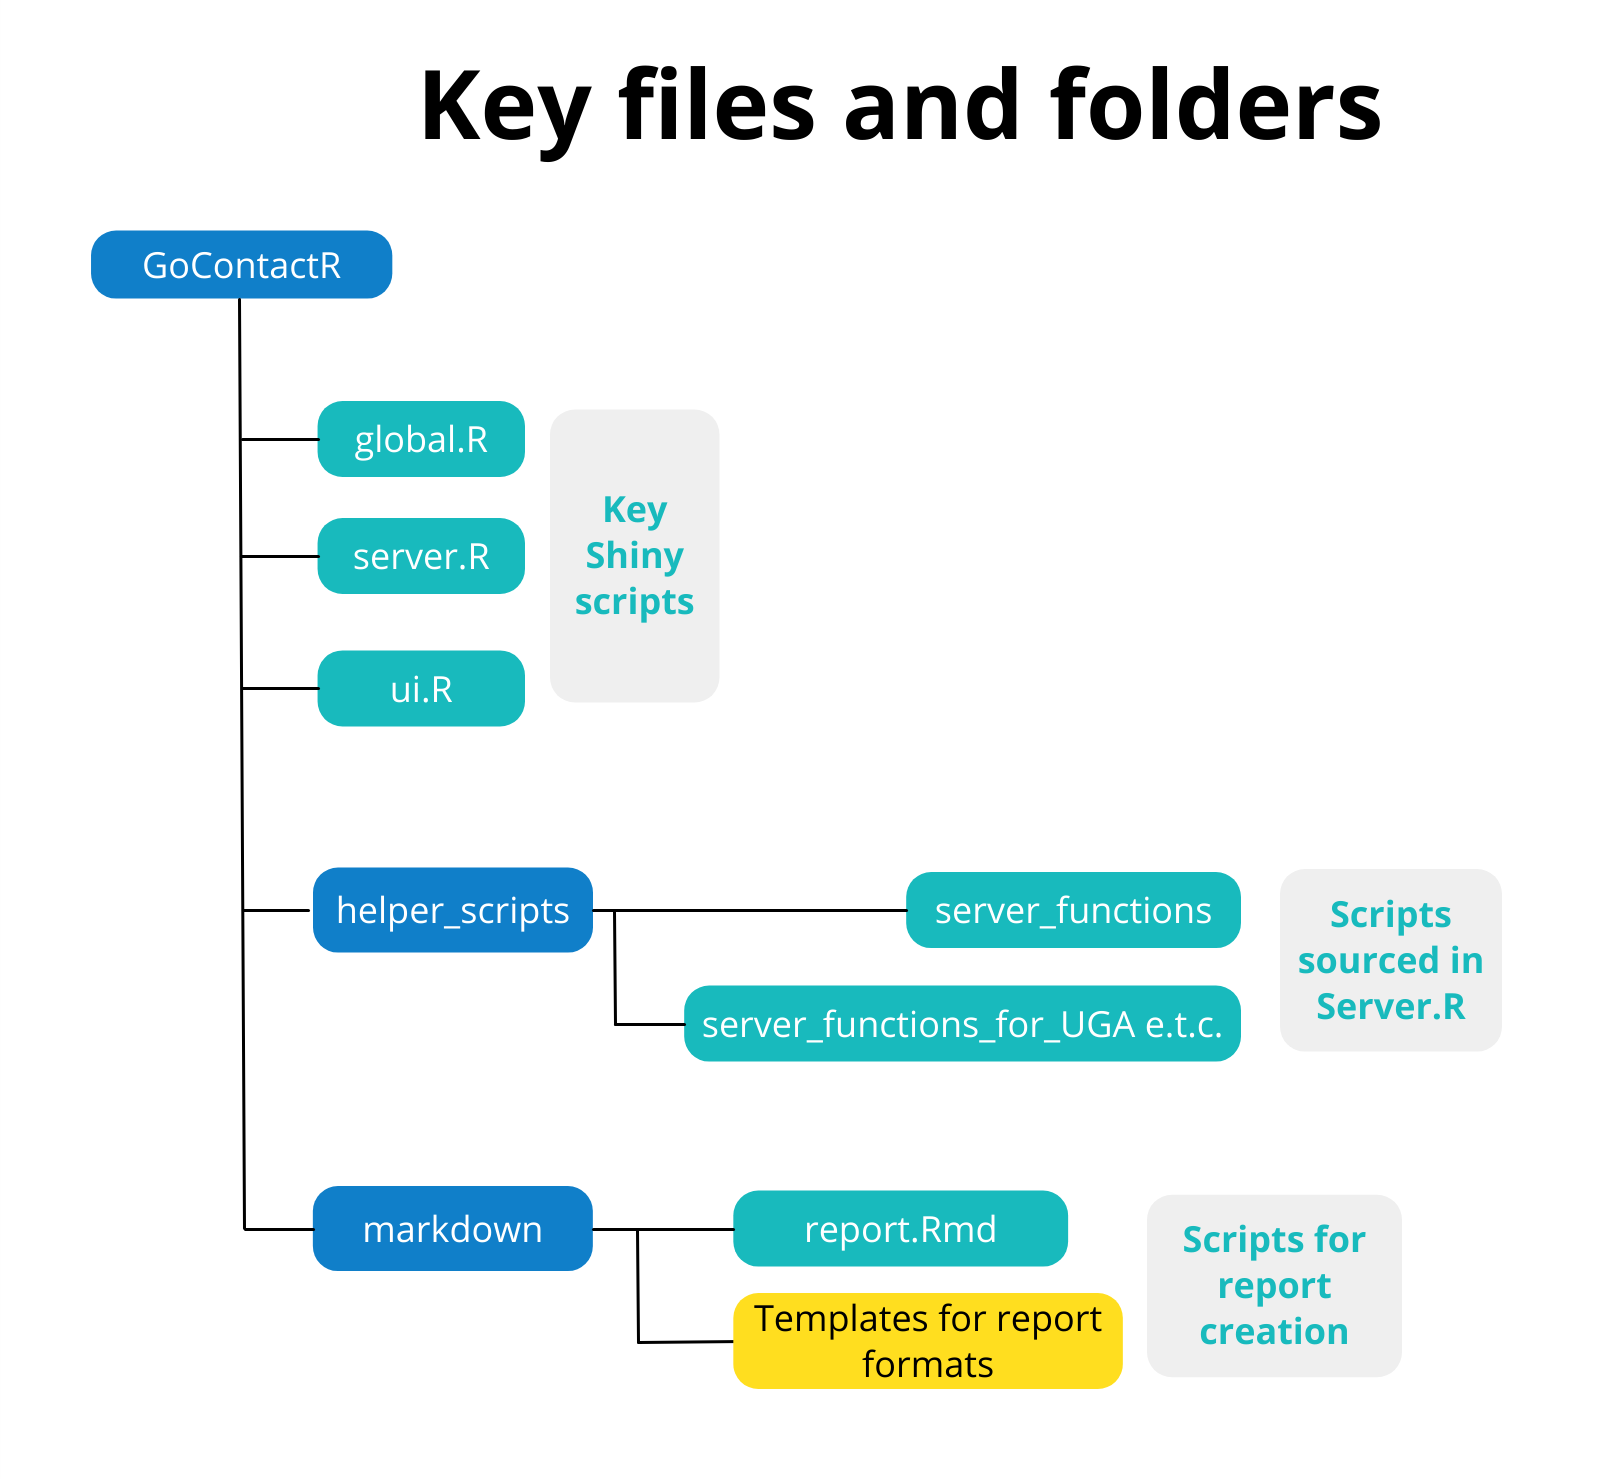
The application is split into the global.R, server.R and ui.R files. The server file sources its functions from the helper_scripts folder.
Data Flow
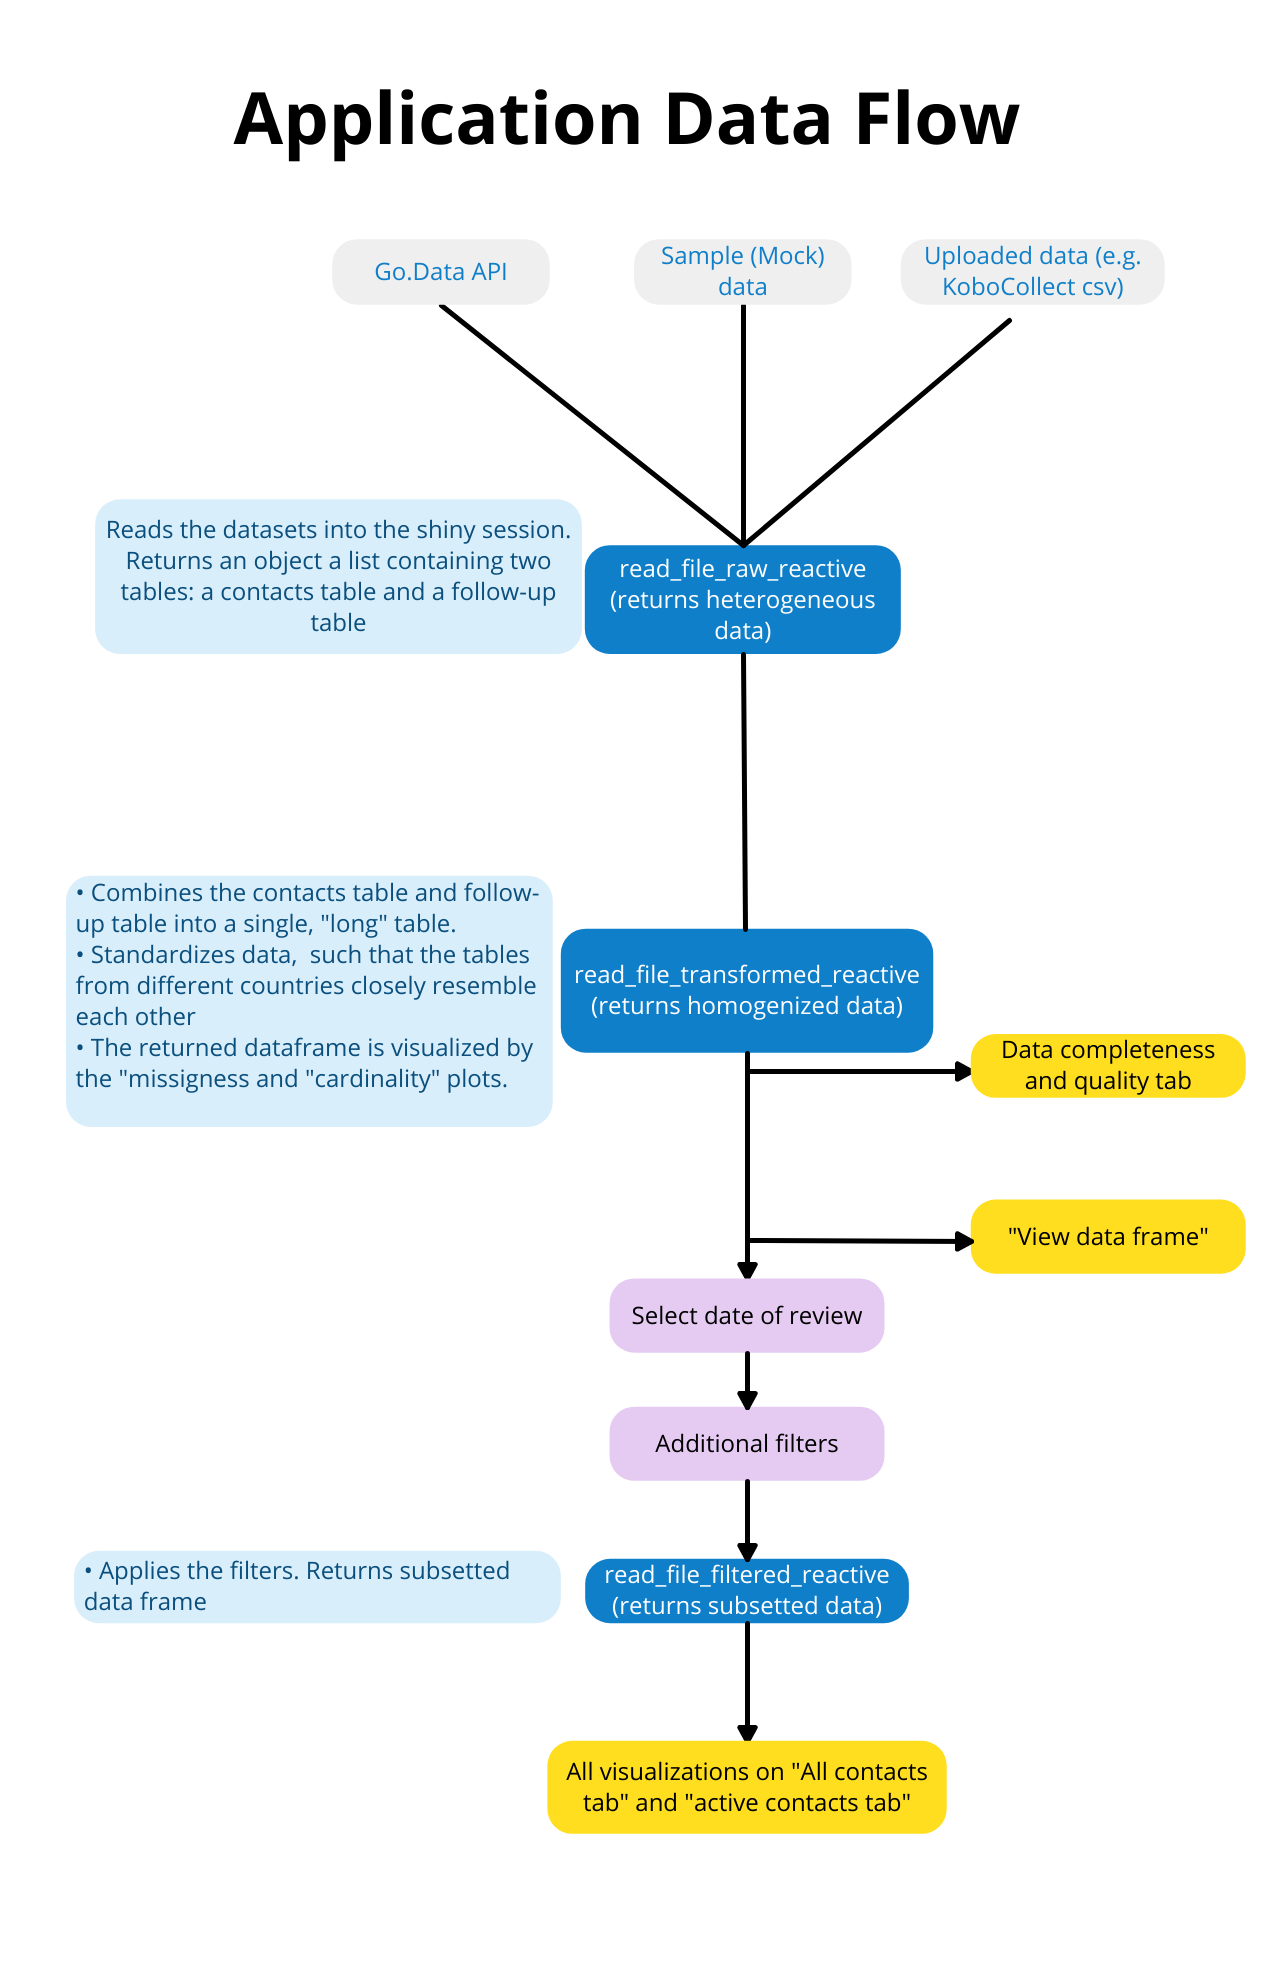
The data flow for the application is fairly straightforward. A single dataset is loaded in with the read_file_raw function, processed with the read_file_transformed function, filtered with the read_file_filtered function, then passed on to all the application outputs.
